Chapter Editor: John Campbell
Background
The Hubbard Brook Experimental Forest (HBEF) was established well before the issue of climate change emerged. However, many of the long-term measurements collected at the site have become valuable climate change indicators (Table 1). Although these records might not provide information relative to climate change separately, combined they provide convincing evidence of climate change at the HBEF that is compatible with regional trends in the northeastern U.S. (Hayhoe et al. 2007; Melillo et al. 2014). A summary of the climatic characteristics of the HBEF most suitable for inclusion in research reports can be found in the Introduction chapter of this book.
|
Meteorological |
Hydrological |
Soil |
Biological |
|
Air temperature |
Lake ice in/out |
Soil temperature |
Phenology |
|
Solar radiation |
Streamflow |
Soil moisture |
Birds |
|
Relative humidity |
Precipitation |
Soil frost |
Vegetation composition |
|
Wind speed |
Stream temperature |
Stream sediment yield |
Tree growth |
|
|
Snow depth/SWE |
|
Litterfall |
None of the long-term measurements at the HBEF were initiated for studying climate alone, but rather were collected to help understand other topics such as streamflow, biogeochemical dynamics, and forest growth. Some of the hydrometeorological measurements were initiated because of a need for data as input for computer models, most notably the BROOK model. BROOK was pioneering when it was first developed in the 1970’s and is still in wide-use today (Federer 2015). As a result, compared to most other similar research sites, the hydrometeorological records from the HBEF are long and comprehensive.
Although climate data at the HBEF are rich by most standards, there are some limitations that need to be considered when evaluating long-term trends. Perhaps most importantly, the methods for some of the measurements have changed over the years. For many years, the continuous measurements at the HBEF were made with analog devices, which have now all been replaced with digital sensors. In some cases, changes in instrumentation have been relatively seamless with negligible effects on the long term record, whereas in other cases the transitions have not been smooth. For example, the anemometer at the U.S. Forest Service Headquarters building malfunctioned in 2004 and was replaced with a different model with no period of overlap for correction, resulting in a step function in wind speed. Other records contain long gaps when instruments were not functioning (e.g., solar radiation, relative humidity). These types of problems cannot always be corrected reliably, hampering our ability to evaluate trends. Nevertheless, a large number of records at the HBEF have been collected consistently at the same locations using the same methods with the same or comparable instruments. In this chapter, we focus on a few of the measurements with which we have a high level of confidence and are well-suited for evaluating climate change.
The trends in this chapter were analyzed with the non-parametric Mann-Kendall test, which is commonly applied to analyses of long-term hydrometeorological data (Kendall, 1938; Helsel and Hirsch, 1992). One of the advantages of this test is that it is rank-based, making it suitable for non-normally distributed data, data containing outliers and non-linear trends such as those often encountered in long-term hydrometeorological research. The slope for each trend was calculated as the median of all possible pair-wise slopes (Sen, 1968).
Air Temperature
Air temperature has been measured at seven locations at the HBEF; one location at the U.S. Forest Service Headquarters building (HQ) and six locations in the vicinity of the gaged watersheds (Bailey et al. 2003; see also Introduction chapter, Figure 1). Air temperature measurements have been collected for various time periods at different locations beginning shortly after the establishment of the HBEF in 1955. The oldest records are from Station 1 (STA1) and HQ, which respectively began in 1956 and 1957.
Long-term mean annual air temperature ranges from 3.7 to 6.7 °C across the seven sites where it is measured, and generally increases with elevation slightly more than the adiabatic lapse rate (0.5 vs 0.6 °C degrees per 100 m. At STA1, mean monthly air temperature ranges from a high of 19 °C in July to a low of -8 °C in January. The highest mean daily temperature ever recorded was 37 °C in on July 22, 2011 at HQ and the low was -36 °C on January 23, 1976 at STA14.
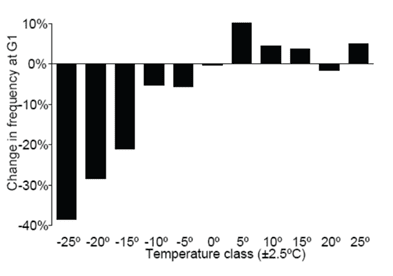
Figure 1. Change in the frequency of days in each air temperature class at the HBEF. Values are frequency of days in each bin between 1986 and 2005 expressed as a percentage change from its frequency between 1958 and 1977. (Hamburg et al. 2013).
Observations show an overall warming trend at the HBEF, with air temperatures increasing by about 1.4 °C over the past 60 years at STA1. Air temperature increases have been recorded across all seasons, but winter temperatures have risen the most, with average winter temperatures warming by 2.0 °C since 1956. Fall temperatures have warmed the least, amounting to 0.9 °C over this period. Daily minimum temperatures, which typically occur at night, have risen by an average of 1.7 °C, while daily maximum temperatures have risen by 1.3 °C since 1956. The number of warm days has increased slightly at the HBEF, whereas the number of extremely cold days has decreased (Figure 1). The loss of extremely cold days is one of the most striking observations in the air temperature record, and has important biological implications. For example, cold snaps during winter keep insect populations in check, and are especially important for limiting the spread of invasive species northward. Warmer winter temperatures may remove barriers to both native and non-native species, potentially resulting in declines in forest health and changes in species composition.
Precipitation
Precipitation is collected at a network of gages surrounding the area of the experimental watersheds and at the main headquarters (HQ) (for further details on instrumentation, see Bailey et al. 2003). In 2017, the network was reduced from 24 to 11 gages in an effort to reduce costs by improving the efficiency of the monitoring program (Green et al. in review). Like air temperature, the records of precipitation vary in length, with the oldest dating back to 1956 at stations 1-4.
Long-term mean annual precipitation ranges from 1326 to 1607 mm across the 24 gages where it has been measured. There is a slight increase in precipitation with elevation and there is also a slight increase from east to west (Bailey et al. 2003). In general, precipitation is frequent at the HBEF, and some form of measurable precipitation occurs in about one out of every three days. Unlike many other regions, precipitation is distributed fairly evenly throughout the year and does not follow a strong seasonal pattern. About 30% of annual precipitation falls as snow. The biggest precipitation event ever recorded began on June 28, 1973 and dropped over 17 cm of rain in 57 hours.
The annual volume of precipitation has been increasing at the HBEF, amounting to a total increase of about 300 mm since 1956 (Figure 2). Interestingly, there has been no significant increase in winter precipitation, and the increases in annual precipitation are attributed to increases that have occurred during the other three seasons. This finding differs from future climate change projections for the northeastern U.S., which predict greater increases in winter precipitation during the 21st century, and little to no change in summer precipitation (Hayhoe et al. 2007). Determining the reasons for this apparent disagreement between recent trends and model projections presents an important challenge for regional climatology.
Figure 2. Trends an annual precipitation at the HBEF compared to the regional average (i.e., Bethlehem and Hanover, NH, and St. Johnsbury, VT). Data from NOAA's National Centers for Environmental Information (https://www.ncei.noaa.gov/). This figure is updated with current data available in the Environmental Data Initiative Repository (EDI; https://portal.edirepository.org) and at NOAA NCEI. Hover over graph to access interactive controls available at the top right (zoom/pan/etc).
Compared to air temperature, precipitation is more variable from year-to-year, and these increasing trends in precipitation are only significant at gages with longer records (Campbell et al. 2010). It should be noted that the rain gages that have been in operation the longest also captured a period of drought in the 1960’s. This was a well-documented multi-year drought that had major impacts in the northeastern U.S. (Namias 1966). In recent decades there has been a shift toward a wet phase. Consequently, the longest precipitation records at the HBEF are bookended by a dry period at the beginning of the record and a wet period at the end of the record. The increases in precipitation that have been observed at the HBEF for this time period are slightly greater than increases in the broader region, and annual precipitation at the HBEF and broader region is greater now than ever before in recorded history.
In addition to changes in mean values, there is also evidence supporting increases in extreme precipitation events. The number of days per year with heavy precipitation, defined as days with more than ≥ 20 mm of rain, has increased significantly by about 7.4 days since 1956. This trend is consistent with observations from other locations across the northeastern U.S. showing a 70% increase in “extremely heavy storms” since the 1950s, as reported in the 2014 National Climate Assessment (Melillo et al. 2014).
Not surprisingly, increased precipitation has led to an increase in soil moisture (Groffman et al. 2012), with potential impacts on many different ecological processes. Because soil biota are so strongly influenced by available water, increases in soil moisture can enhance decomposition, mineralization, trace gas fluxes, and solute export. Additionally, the major flooding events that have occurred at the HBEF tend to happen when substantial rains fall on soils that have already been saturated from a previous storm. Therefore, these wetter conditions can increase the likelihood of major flooding events with potential economic and societal impacts. Moreover, an increase in the extent and duration of local saturation of soils could result in changes in the occurrence of anaerobic onditions and consequent microbial processes such as denitrification.
Snowpack and Soil Frost
Snowpack has been measured under the forest canopy at 21 locations for various time periods at the HBEF; however, only 5 of these sites have been monitored over the long-term and are still in operation today. The snowpack is measured weekly along a snow course that consists of 10 points spaced 2 m apart. At each point, field technicians use a Mt. Rose snow tube to measure the depth of the snow, and also to extract and weigh a core of the snowpack to determine the snow water equivalent (SWE). Snow water equivalent is a measure of the amount of water contained in the snowpack and is more temporally stable and hydrologically meaningful than snow depth. Manual measurements of soil frost are made weekly at a single point adjacent to the snow courses. Technicians dig through the snow, use a hatchet to cut through the frozen soil, look and feel where the frost line is, and measure the total depth from the surface of the forest floor. Although both the snowpack and soil frost measurement methods are somewhat rudimentary, they are effective and have remained consistent over the entire records, providing confidence in observed trends over time.
Historically, the HBEF has had a continuous snowpack throughout the winter that on average persists from late December until mid-April, with a peak depth in March. Since air temperatures are getting warmer and the volume of precipitation in winter has not changed, it is not surprising that the snowpack has declined over the periood of record. The long-term average annual maximum snow depth and corresponding snow water equivalent (SWE) ranges from 47 cm (12 cm SWE) to 101 (27 cm SWE) at HQ and STA17, respectively. At STA2, which has the longest record (beginning in 1956), maximum annual snow depth has declined by 29 cm (9 cm SWE). The length of the snow-covered period is also getting shorter. On average there are 111 days with snow cover at STA1. The number of days with snow cover has declined by about 20 days over the record (Figure 3). The changes in the snowpack have resulted in shifts in hydrology (see Hydrology chapter for more detail). The annual hydrograph at the HBEF is characterized by low streamflow during winter as precipitation accumulates in the snowpack, followed by a snowmelt peak during spring runoff. The declining snowpack has caused a flattening of the hydrograph, due to more frequent melting events during winter that recharge groundwater, and a reduction in the spring peak caused by less snowpack accumulation and melt (Campbell et al. 2011).
Figure 3. Long-term trends in the maximum annual snow depth, maximum annual snow water equivalent, and number of days with snow cover measured at weather station 2 at Hubbard Brook Experimental Forest. (Original figure in Campbell et al., 2007). This figure is updated with current data available in the Environmental Data Initiative Repository (EDI; https://portal.edirepository.org). Hover over graph to access interactive controls available at the top right (zoom/pan/etc).
Soil frost is present approximately two out of every three years at the HBEF, depending on how cold it is at the onset of winter and when the snowpack begins to develop (Campbell et al. 2010). Once the ground is frozen, it generally stays frozen beneath the snowpack throughout the entire winter. The average annual maximum soil frost depth ranges from 2 cm at STA9 to 9 cm at HQ.
The deepest soil frost ever recorded was 30 cm in 1980 at STA17. Soil frost is highly variable from year-to-year at the HBEF and no long term trends are evident. However future climate change modeling done with HBEF data indicates that although the annual maximum depth of soil frost is not expected to change much in the future, the number of freeze-thaw events will increase and the number of days with soil frost will decline stemming from a concurrent decline in the number of snow-covered days (Campbell et al. 2010). These potential changes in soil frost regimes have important implications for forest ecosystem processes such as hydrological flowpaths during winter, biogeochemical processes in soil, and tree phenology and growth. For example, Mitchell et al. (1996) indicated that high nitrate loss from the HBEF watersheds followed severe soil frost events.
Vegetation
Climate change has the potential to affect the growth, composition and health of vegetation in many ways. The HBEF lies on the northern hardwood and spruce-fir ecotone. On the warmer, lower elevation, south-facing watersheds, northern hardwoods comprise 83 to 99% of the forest cover, whereas the colder, higher elevation north-facing watersheds have a greater proportion of spruce-fir (73 to 97%; National Land Cover Dataset, Homer et al. 2015). It has been suggested that as the climate changes, spruce-fir should recede upslope, with northern hardwoods filling in behind it (Beckage et al. 2008). However, at the HBEF there is little evidence to support this with existing data. In fact, data from the HBEF (van Doorn et al. 2011) and the larger region indicate that spruce-fir is becoming more prevalent at lower elevations (Foster and D’Amato 2015). Undoubtedly, climate is one of many factors that influences tree species composition, but it is not clear how the combination of climate change with other changes will alter future vegetation assemblages.
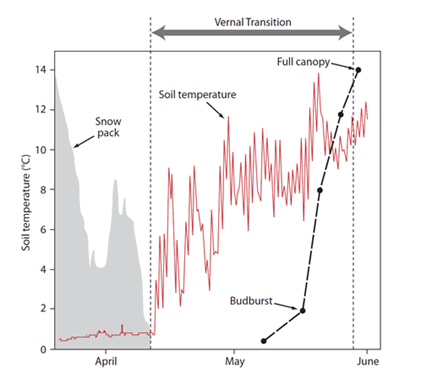
Figure 4. The vernal transition is defined as the period between the last day of snowpack and the day of full canopy expansion. This period is characterized by a sharp increase in soil temperature that triggers biological activity in soils. (Groffman et al., 2012).
Extreme weather events are perhaps a more important influence on vegetation than subtle shifts in climate over time. These events are projected to increase in number and strength in the future, owing to more energy in the atmosphere. Some examples of documented extreme weather events at the HBEF with direct effects on vegetation include ice storms, hurricanes, microbursts, hail storms, droughts, floods, spring freeze events, fall snowfall events, and episodes of soil freezing. Additionally, changes in climate can open a Pandora’s box of indirect effects, such as outbreaks of pests and pathogens, and fire. Because of these complexities, there is much uncertainty about how climate change may affect vegetation at the HBEF in the future.
Measurements of plant phenology provide some of the most useful information for evaluating how climate change is affecting vegetation. Tree phenology is the study of the seasonal occurrence of developmental or life cycle events, such as budbreak, flowering, or autumn leaf drop. Measurements of phenology were initiated at the HBEF in 1989 at nine plots along an elevation gradient. Each spring and autumn, field technicians visit the plots and record the phenological stage of trees.
The record at the HBEF does not indicate that significant shifts in phenology have occurred during the period of observation. However, retrospective modeling of phenology does show evidence of a longer growing season (i.e., beginning in 1957 following Richardson et al. 2006). These modeled phenology data enable comparison of shifts in phenological phases with climate change drivers (Groffman et al. 2012). For example, during spring there is a vernal transition period between the time when the snowpack completely melts and when leaf-out occurs (Figure 4). This transition period appears to be lengthening, meaning that the rate of change for leaf-out is slower than the change for snowmelt, because leaf-out is not only affected by a warmer climate, but also by photoperiod which is not changing. After snowmelt occurs, soil temperatures rapidly increase, creating a “spring trigger” that stimulates microbial mineralization, mobilizing nutrients in soil solution. Because nutrient uptake by trees is generally low before leaf-out, the greatest losses of nutrients to streams occurs during this time. As this transition period gets longer, the amount of nutrients leached to streams could increase, potentially impairing water quality and soil fertility. These observations from the HBEF illustrate the marked changes that have occurred in the physical environment in the spring and fall seasons, which may exacerbate existing seasonal asynchronies between microbial activity and plant uptake.
Climate Change Manipulation Experiments
While long-term data are valuable for identifying trends in climate and responses over time, field manipulation experiments are used to elucidate cause-and-effect relationships and improve mechanistic understanding. Ideally replicated experiments can be combined with long-term monitoring data to mechanistic models and provide a robust evaluation of climate change effects on ecosystem processes. There have been many different climate change manipulation experiments at the HBEF ranging from small laboratory experiments to larger plot-scale field studies. Here we highlight four of the more comprehensive studies that have occurred at the site (Figure 5).
Soil Freezing Experiments
Soil freezing is an important below-ground perturbation, having implications for the hydrology, biology and chemistry of ecosystems. At the HBEF, soil freezing impacts have primarily been investigated using snow removal experiments beginning in the mid-1990's (Groffman et al. 1999, 2001; Figure 5a), but also more recently with natural gradients in soil freezing that occur across a range in elevation (Duran et al. 2016; Fuss et al. 2016). Snow removal experiments involve shoveling off the insulating layer of snow, thereby exposing the soil to cold winter air temperature to induce soil freezing. This research has shown that relatively mild freezing events (soil temperatures never decreasing below -4 °C) produced significant increases in soil inorganic nitrogen levels, solute leaching, root mortality and nitrous oxide flux. These responses to mild freezing were surprising in view of laboratory studies that suggested significant biogeochemical effects would only occur with a freezing event sufficiently severe (> -10 °C) to directly cause root and microbial mortality. Apparently damage to roots by mild freezing is sufficient to reduce nitrogen uptake, thereby causing increased losses of nitrate from soils (Campbell et al., 2014).
Climate Change Across Seasons Experiment
Whereas many studies have evaluated the impacts of climate change on forests within a single season, few have examined the impacts of climate change across seasons and how these impacts interact. A study called Climate Change Across Seasons (CCASE) was initiated in 2012 to determine the interactive effects of winter and growing season climate on water and nutrient uptake and carbon sequestration in northern hardwood forests (Templer et al. In Review; Figure 5b). This study involves snow removal during winter to induce soil freezing, combined with warming during summer. Summer warming was accomplished by burying heating cables and maintaining the soil at 5 °C above ambient. The investigators hypothesize that warmer soil temperatures during the growing season will increase forest productivity, as well as rates of water, carbon, and nutrient uptake by trees and saplings. However, they expect that a reduced winter snowpack and increased soil freezing will offset these changes by damaging roots. Results from this study will improve understanding of the effects of climate change on rates of carbon sequestration and nutrient retention in these forests, as well as potential effects on air and water quality.
Drought-Net Experiment
While mean annual precipitation in the Northeast is projected to increase modestly in the coming decades (especially in winter), it is expected to fall in fewer, more intense storms, with longer intervening dry periods. When combined with other changes in climate (i.e., less consistent snowpack, earlier snowmelt, and longer and hotter growing season), the altered precipitation regime may lead to a dramatic increase in growing season water stress in a region where species are not well adapted to drought. A throughfall removal experiment was initiated in 2014 to better understand the impacts of drought in mesic northern hardwood forests (Asbjornsen et al. In prep; Figure 5c). A series of troughs covering 50% of the ground surface was installed above plots to simulate a 1st percentile drought based on the long-term meteorological record. Drought and control plots are compared to determine the effect of reduced soil moisture availability on tree growth among other things.
Ice Storm Experiment
Ice storms are rare and typically localized extreme weather events that are difficult to predict and have impacts that are poorly understood. An ice storm field manipulation experiment at the HBEF is being used to improve mechanistic understanding of short term ecological responses (Rustad et al. In prep; Figure 5d). During the winter of 2016, stream water was sprayed above the forest canopy when air temperatures were below freezing,effectively simulating a natural ice storm. The experimental design consists of plots with three levels of ice thickness treatment (0.25", 0.50" and 0.75″ of ice accretion), as well as a control. The plots with the two more severe icing treatments experienced significant tree damage, creating canopy gaps. These plots also had large inputs of fine and coarse woody debris to the forest floor. The exposure to light and presence of brush piles in the more heavily damaged plots resulted in warming with increased spatial variability of soil temperature.
It was expected that the warmer temperatures in heavily damaged plots would result in an increase in soil respiration; however preliminary results indicate that soil respiration was actually lower in these plots possibly because of reduced root growth as noted following the natural ice storm event of 1999. It was also expected that nutrients in soil solution would increase due to lack of uptake by damaged vegetation. However, preliminary results have shown no significant changes in soil solution losses of nutrients despite significant forest canopy damage. Further monitoring will determine whether these trends continue in the future.
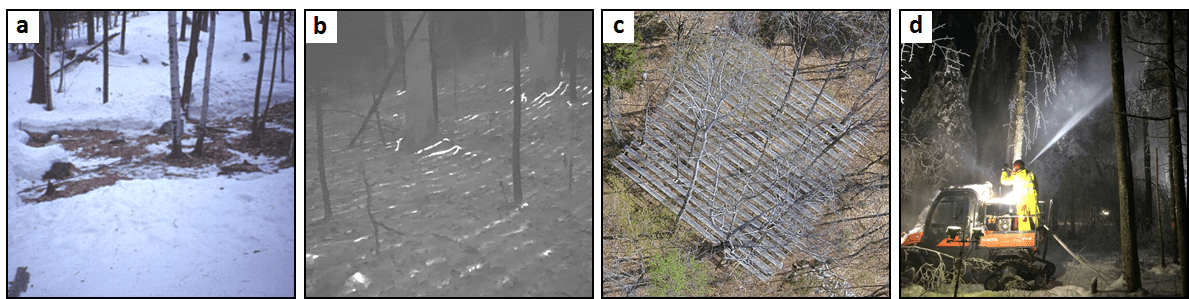
Figure 5. Climate change manipulation experiments at the HBEF including: (a) snow removal to induce soil freezing; (b) heating cables to warm plots as shown with a thermal image; (c) throughfall exclusion to simulate drought; and, (d) spraying water over the canopy during cold weather to create an Questions for Further Study.
Questions for Further Study
- How are impacts from climate change compounded or alleviated by other local and global change drivers?
- Are there climatic thresholds that when exceeded, result in irreversible change in ecosystem structure, function and composition?
- Is climate change exacerbating ecological asynchronies?
- Will wetter soils enhance microbial processing and nutrient export including localized anaerobic processes?
- How do the impacts from aboveground disturbances, such as ice storms, differ from belowground disturbances, such as soil freezing?
- Why do model projections of regional climate change suggest increasing winter precipitation whereas records indicate increasing summer precipitation?
Access Data
- USDA Forest Service, Northern Research Station. 2021. Hubbard Brook Experimental Forest: Daily Precipitation Rain Gage Measurements, 1956 - present ver 17. Environmental Data Initiative.
https://doi.org/10.6073/pasta/453b49e8429a63b72419caf3b9ad6f98 -
USDA Forest Service, Northern Research Station. 2021. Hubbard Brook Experimental Forest: Daily Temperature Record, 1955 - present ver 10. Environmental Data Initiative.
https://doi.org/10.6073/pasta/3afab60d54d5f2fcb1112e71f4be2106 -
USDA Forest Service, Northern Research Station. 2021. Hubbard Brook Experimental Forest: Weekly Snow and Frost Measurements, 1955 - present ver 16. Environmental Data Initiative.
https://doi.org/10.6073/pasta/f448b4b563d3f59b2058291459ce5926
See the full Hubbard Brook data catalog to find more meteorogical data, and data on experimental climate manipulation projects.
References
Bailey, A. S., J. W. Hornbeck, J. L. Campbell and C. Eagar. 2003. Hydrometeorological database for Hubbard Brook Experimental Forest: 1955-2000. General Technical Report NE-305. U.S. Department of Agriculture, Forest Service, Northeastern Research Station, Newtown Square, PA. 36 p.
Beckage, B., B. Osborne, D. G. Gavin, C. Pucko, T. Siccama and T. Perkins. 2008. A rapid upward shift of a forest ecotone during 40 years of warming in the Green Mountains of Vermont. Proceedings of the National Academy of Sciences 105:4197–4202.
Campbell, J. L., A. M. Socci and P. H. Templer. 2014. Soil freezing reduces uptake of nitrogen by fine roots in a northern hardwood forest. Global Change Biology 20(8):2663-2673 doi:10.1111/gcb.12532.
Campbell, J. L., C. T. Driscoll, A. Pourmokhtarian and K. Hayhoe. 2011. Streamflow responses to past and projected future changes in climate at the Hubbard Brook Experimental Forest, New Hampshire, USA. Water Resource Research, 47, W02514, doi:10.1029/2010WR009438
Campbell, J. L., S. V. Ollinger, G. N. Flerchinger, H. Wicklein, K. Hayhoe and A. S. Bailey. 2010. Past and projected future changes in snowpack and soil frost at the Hubbard Brook Experimental Forest, New Hampshire, USA. Hydrological Processes 24, 2465-2480.
Campbell, J. L., C. T. Driscoll, C. Eagar, G. E. Likens, T. G. Siccama, C. E. Johnson, T. J. Fahey, S. P. Hamburg, R. T. Holmes, A. S. Bailey and D. C. Buso. 2007. Long-term trends from ecosystem research at the Hubbard Brook Experimental Forest. Gen. Tech. Rep. NRS-17. U.S. Department of Agriculture, Forest Service, Northern Research Station. Newtown Square, PA. 41 p.
Durán, J., J. L. Morse, P. M. Groffman, J. L. Campbell, L. M. Christenson, C. T. Driscoll, T. J. Fahey, M. C. Fisk, G. E. Likens, J. M. Melillo, M. J. Mitchell, P. H. Templer and M. A. Vadeboncoeur. 2016. Climate change decreases nitrogen pools and mineralization rates in northern hardwood forests. Ecosphere 7(3):e01251-n/a doi:10.1002/ecs2.1251.
Federer, C.A. 2015. BROOK 90: A simulation model for evaporation, soil water, and streamflow. http://www.ecoshift.net/brook/brook90.htm.
Foster, J. R. and A. W. D'Amato. 2015. Montane forest ecotones moved downslope in northeastern USA in spite of warming between 1984 and 2011. Global Change Biology 21, 4497-4507. doi: 10.1111/gcb.13046
Fuss, C. B., C. T. Driscoll, P. M. Groffman, J. L. Campbell, L. M. Christenson, T. J. Fahey, M. C. Fisk, M. J. Mitchell, P. H. Templer, J. Durán and J. L. Morse. 2016. Nitrate and dissolved organic carbon mobilization in response to soil freezing variability. Biogeochemistry 131(1):35-47 doi:10.1007/s10533-016-0262-0.
Green, M. B., J. L. Campbell, R. D. Yanai, S. W. Bailey, A. S. Bailey, N. Grant, I. Halm, E. P. Kelsey and L. E. Rustad. In Review. Downsizing a long-term precipitation network: using a quantitative approach to inform difficult decisions. Submitted to PLOSone
Groffman, P. M., L. E. Rustad, P. H. Templer, J. L. Campbell, L. M. Christenson, N. K. Lany, A. M. Socci, M. A. Vadeboncoeur, P. G. Schaberg, C. T. Driscoll, T. J. Fahey, M. C. Fisk, C. L. Goodale, M. B. Green, S. P. Hamburg, C. E. Johnson, M. J. Mitchell, J. L. Morse, L. H. Pardo, N. L. Rodenhouse and G. F. Wilson. 2012. Climate change effects are manifest in complex and surprising ways in the northern hardwood forest. BioScience 62:1056-1066.
Groffman, P. M., C. T. Driscoll, T. J. Fahey, J. P. Hardy, R. D. Fitzhugh and G. L. Tierney. 2001. Colder soils in a warmer world: A snow manipulation study in a northern hardwood forest ecosystem. Biogeochemistry 56, 135-150.
Groffman, P. M., J. P. Hardy, S. Nolan, R. D. Fitzhugh, C. T. Driscoll and T. J. Fahey. 1999. Snow depth, soil frost and nutrient loss in a northern hardwood forest. Hydrological Processes 13(14-15):2275-2286.
Hamburg, S. P., M. Vadeboncoeur, A. D. Richardson and A. S. Bailey. 2013. Climate change at the ecosystem scale: A 50-year record in New Hampshire. Climatic Change 116:457–477.
Hayhoe, K., C. P. Wake, T. G. Huntington, L. Luo, M. D. Schwartz, J. Sheffield, E. Wood, B. Anderson, J. Bradbury, A. DeGaetano, T. J. Troy and D. Wolfe. 2007. Past and future changes in climate and hydrological indicators in the US Northeast. Climate Dynamics 28:381-407.
Helsel, D. R. and R. M. Hirsch. 1992. Statistical Methods in Water Resources. Elsevier Science: Amsterdam; 522 p.
Homer, C. G., J. A. Dewitz, L. Yang, S. Jin, P. Danielson, G. Xian, J. Coulston, N. D. Herold, J. D. Wickham and K. Megown. 2015. Completion of the 2011 National Land Cover Database for the conterminous United States - Representing a decade of land cover change information. Photogrammetric Engineering and Remote Sensing 81(5):345-354.
Kendall, M. 1938. A new measure of rank correlation. Biometrika 30, 81-93.
Melillo, J. M., T. C. Richmond and G. W. Yohe. (eds.). 2014. Climate Change Impacts in the United States: The Third National Climate Assessment. U.S. Global Change Research Program, 841 pp. doi:10.7930/J0Z31WJ2.
Mitchell, M. J., C. T. Driscoll, J. S. Kahl, G. E. Likens, P. S. Murdoch and L. H. Pardo. 1996. Climatic control of nitrate loss from forested watersheds in the northeast United States. Environmental Science and Technology 30:2609-2612.
Namias, J. 1966. Nature and possible causes of the northeastern United States drought during 1962–65. Monthly Weather Review 94:543-554.
Richardson, A. D., A. S. Bailey, E. G. Denny, C. W. Martin and J. O'Keefe. 2006. Phenology of a northern hardwood forest canopy. Global Change Biology 12:1174-1188.
Sen P. K. 1968. Estimates of the regression coefficient based on Kendall’s tau. Journal of the American Statistical Association 63:1379–1389.
Van Doorn, N. S., J. J. Battles, T. J. Fahey, T. G. Siccama and P. A. Schwarz. 2011. Links between biomass and tree demography in a northern hardwood forest: a decade of stability and change in Hubbard Brook Valley, New Hampshire. Canadian Journal of Forest Research 41:1369-1379.


