Chapter Editors: John Battles
Introduction
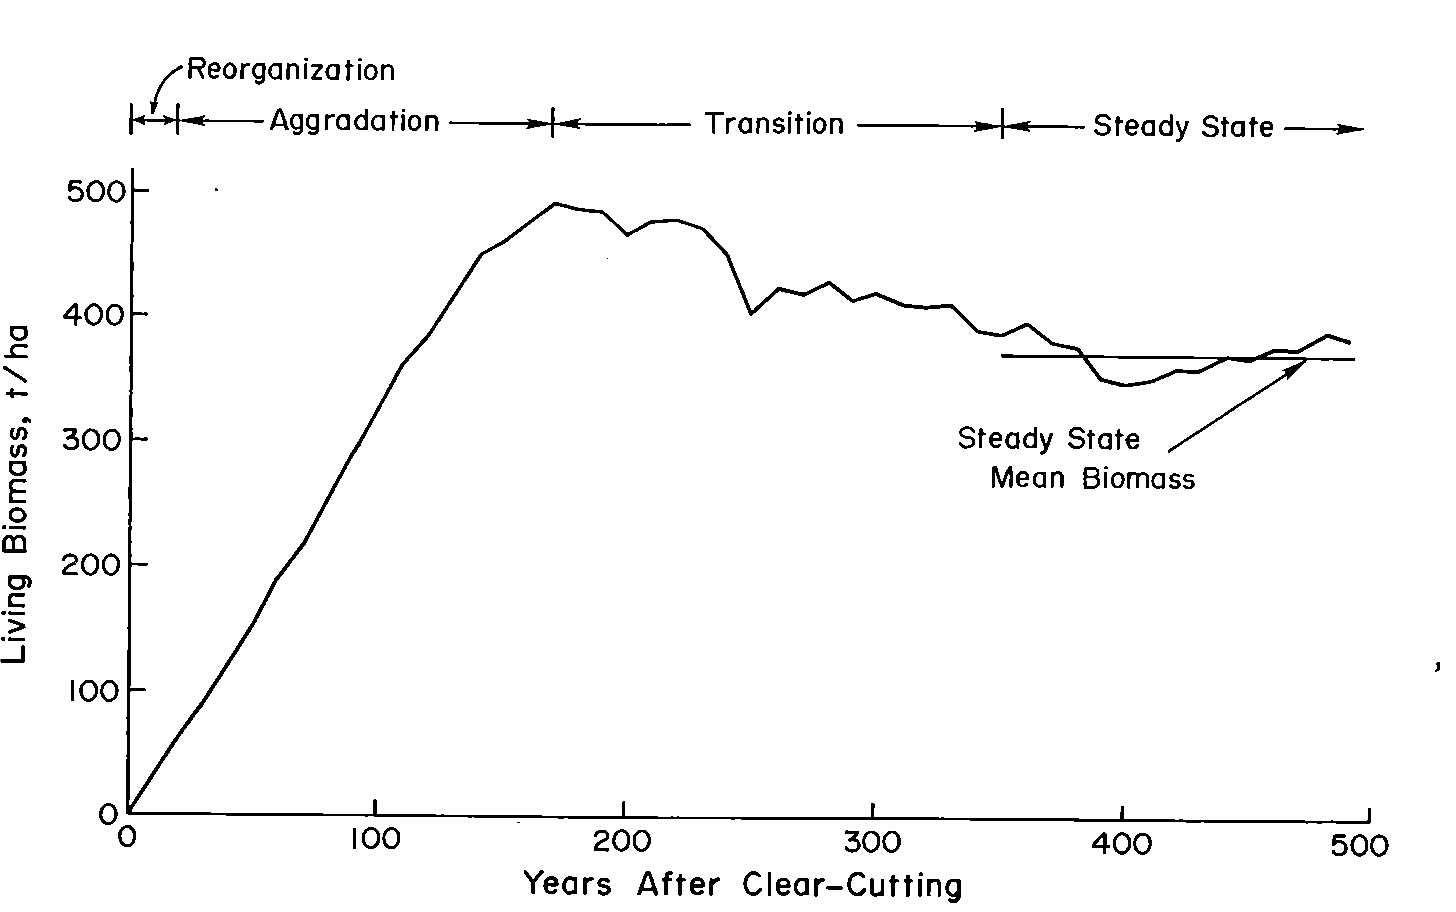
Figure 1. Changes in living biomass during ecosystem development after clear-cutting based on the average of two JABOWA simulations. (Bormann and Likens, 1979).
Biomass is the living (and sometimes including recently dead) organic material synthesized by plants and other organisms. The accumulation of biomass in forests is greater than in other Earth biomes because trees must effectively lift their leaves above their neighbors in order to compete for the light resource; hence, forest biomass provides the structural material that allows the plants to grow tall. The biomass of trees in forests forms the three-dimensional structure in which all the other organisms are entrained and to which they are adapted for growth, survival and reproduction. Much of the energy and carbon stored in the forest resides in the biomass of the trees and understanding the factors regulating forest biomass and its accumulation is of fundamental importance to ecologists and foresters, alike.
In their classic treatise, Pattern and Process in a Forested Ecosystem, Bormann and Likens (1979) developed a conceptual model for spatial and temporal variation in the biomass of a northern hardwood forest, based upon observations at Hubbard Brook and other regional forests. In the temporal domain, they proposed four phases of ecosystem development following large-scale disturbances (e.g., windstorm, clearcut harvest), culminating in a steady-state phase in which total biomass fluctuates around an equilibrium value (Figure 1). Measurements at Hubbard Brook and elsewhere in the northern hardwood region have provided new insights about this conceptual model and the magnitude and timing of forest biomass accumulation.
Primary productivity is the process resulting from photosynthetic activity of the plants and determines biomass accumulation in forests. Net primary productivity (NPP) represents the difference between gross photosynthesis of plant foliage and energy losses due to respiration and mortality of plant tissues. Although NPP continues in the steady-state phase of forest development, living biomass ceases to accumulate when photosynthetic carbon gain is balanced by losses to plant respiration and mortality. In general, the rate of biomass accumulation during the transient phases of ecosystem development depends upon forest NPP; hence, there has been great interest in understanding the factors constraining NPP and how they may be affected by forest management and environmental change.
In this chapter, we explain current understanding of forest biomass and NPP in the context of the Hubbard Brook ecosystem, including: current measurement techniques; patterns of temporal and spatial variation; the environmental and biotic factors causing this variation; and the implications for responses to global and regional environmental change.
Forest Biomass
In many biomes, direct measurement of biomass can be accomplished simply by weighing the tissue harvested from a measured area (e.g., clipping herbaceous vegetation). This is impractical in forests and indirect approaches have been developed. In general, these rely on the allometric relationships between an easily-measured dimension of the plant and its aboveground biomass. At Hubbard Brook, Whittaker et al. (1974) measured the dimensions (e.g., diameter, height, biomass, etc.) of a sample of 93 trees of different species and sites, and developed allometric equations relating the biomass of individual trees to their diameter and height. Then, by measuring the diameter and height of trees on sampling plots of known area, the forest biomass can be calculated by applying the species-specific allometric equations. A compilation of allometric equations of forest trees in USA has also been published (Jenkins et al. 2003). The statistical uncertainty of these aboveground biomass estimates can also be determined by using Monte Carlo approaches (Yanai et al. 2010)
Measuring the belowground (root) biomass of trees can be more challenging. Both direct and indirect approaches have been applied at Hubbard Brook. Whittaker et al. (1974) actually excavated the root systems of the sampled trees described above, “with the encouragement of dynamite.” This work provided a rare example in which allometric equations include the tree root system, but recovery of the smallest fine roots (<0.5 mm diameter) is incomplete, and these roots are the most functionally important. Alternatively, root biomass can be measured directly by using a quantitative soil pit approach in which all the roots are recovered from a soil pit of known ground area and volume. Fahey et al. (1988) applied this method at Hubbard Brook and found close agreement with estimates obtained using the allometric equations for the coarse roots.
Most of the tree biomass in the mature forest (e.g., 100-yr-old forest at Hubbard Brook) is contained in the woody tissues of the stem and roots (91%), the remainder being leaves (1.7%), bark (5.1%), and fine roots (2.2%). Understory vegetation comprises a very small biomass pool (<1 % of total plant biomass). The ratio of root:shoot biomass varies with site quality and forest age, as discussed later, but averages about 0.25 in mature northern hardwood forest. The biomass of heterotrophic organisms averages less than 0.6% that of plants, and is mostly (~ 96%) comprised of soil microbes (bacteria, fungi).
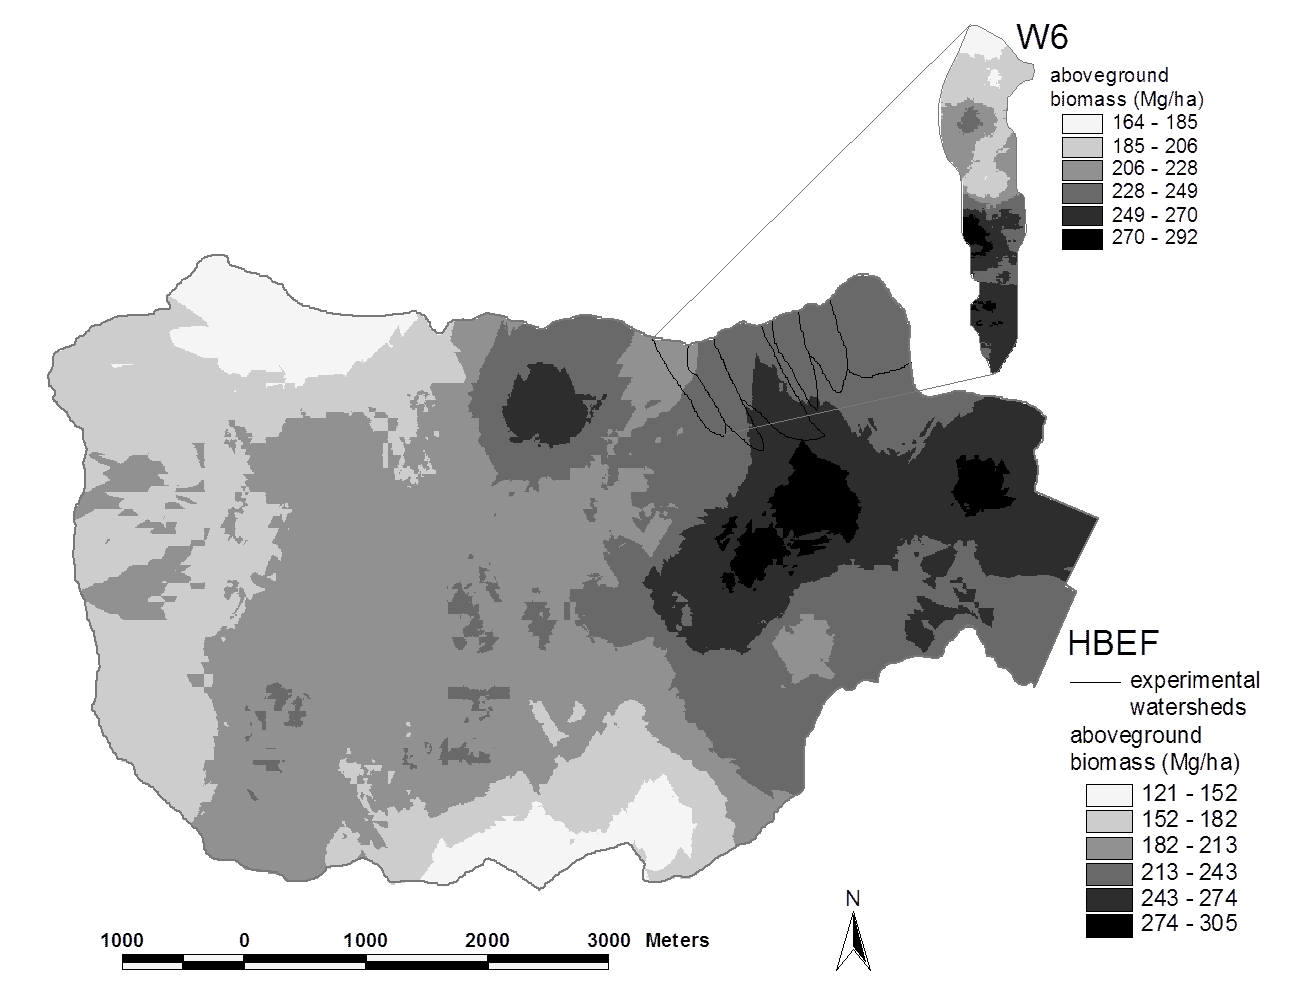
Figure 2. Spatial pattern of estimated aboveground biomass in the reference watershed (W6) and across the Hubbard Brook valley in 1997. The W6 map is based on a 100% survey, gridded at 25 x 25 m spatial scale. The valley-wide interpolations are based on 450 plots (0.05 ha each). Error estimates are given in the text. (Fahey et al., 2005).
Forest biomass represents one of the largest and most sensitive carbon pools on Earth and for that reason, ecologists and policy-makers have become very interested in spatial and temporal patterns of forest biomass. Forest biomass varies markedly among forest biomes, the highest values attained in temperate and tropical rainforests, the lowest in boreal woodlands, and intermediate values in temperate deciduous forests. Within the Hubbard Brook valley a two-fold range of aboveground biomass is observed in the ca. 100-yr-old-forest, with lowest values in fir-birch-spruce forest on thin soils at higher elevations and highest values in mixed hemlock-hardwoods in the lower valley (Figure 2).
Both tree species composition and site quality influence patterns of maximum forest biomass that accumulates in the northern forest region. For example, Kelty (1989) observed that mixed hemlock-hardwood stands support significantly higher biomass than pure hardwood stands, perhaps because of canopy architecture interactions; a similar pattern is seen in the lower valley at HBEF (Figure 2). The site quality influence also appears clearly at HBEF in the considerably higher biomass in enriched soil, “cove” sites on W6 in comparison with adjacent stands on thin soils of steeper slopes (Figure 2, inset).
The northern forest is recognized as a significant sink for C, influencing the global C budget. This is in part because historical forest harvest in the region reduced forest C storage and recovery to the assumed steady-state is still in progress (Woodbury et al. 2007). How long can we expect this ecosystem service to persist? The answer to this question is complex, involving multiple environmental and biotic factors as well as management and policy decisions. The conceptual model of Bormann and Likens (1979) and its application in simulation models originally suggested a transient, maximum forest biomass attained at forest age 150-200 yr followed by slight decline to the steady-state, old-growth phase (Figure 1). Empirical data from the Hubbard Brook forest indicate that live tree biomass reached a plateau much lower than predicted and at the age of only about 80 yr, owing to a variety of factors including exotic insect pests and pathogens (e.g. beech bark disease) and species declines unrelated to such pests (e.g., sugar maple, yellow birch). By comparison, summaries for the region, based upon various sources including USDA Forest Service Forest Inventory and Analysis (Lichstein et al. 2009) suggest an intermediate pattern, with forest biomass in northern hardwoods reaching an asymptote at 125-150 years, at maximum values 30% lower than projected. Higher maximum biomass values may be reached on richer sites such as alluvial valleys (Keeton 2011). As explained below, site quality limitations partly associated with soil nutrient depletion by acid deposition, contribute to forest decline and the observed limitation of forest biomass accumulation at Hubbard Brook and other regional forests (Battles et al. 2014). Moreover, impending invasion by additional exotic pests (hemlock woolly adelgid, emerald ash borer) and effects of changing climate may further constrain forest biomass accumulation. The implication is that the combined effects of soil nutrient depletion, invasive pests and pathogens and climate change could limit the future role of forest biomass accumulation as a continuing sink for atmospheric CO2.
Biomass of the forest in the reference watershed, W6, has been estimated periodically since 1965 by measuring the diameter of every tree in the watershed and applying the allometric equations; these measurements provide a detailed picture of changes in biomass for this previously aggrading forest (Figure 2-2). As noted earlier, the Hubbard Brook Forest accumulated biomass from the age of about 55 years in the early 1960s until the age of about 80 years in the 1980s. Since that time live biomass on W6 has levelled off and even shown some significant decreases owing to both natural disturbances (ice storm in 1998) and tree declines. In particular, widespread decline of sugar maple has contributed to the decrease in live biomass on W6. The cause of this decline is undoubtedly associated with depletion of soil base cations by acid deposition (see Acid Rain chapter). For example, the experimental replacement on W1 of calcium, lost as a result of soil leaching in the 20th century, reinvigorated sugar maple and consequently biomass accumulation resumed in the early 21st century (Figure 2-2). Continued monitoring of these forests and perhaps another dose of calcium will be needed to further inform these trends.
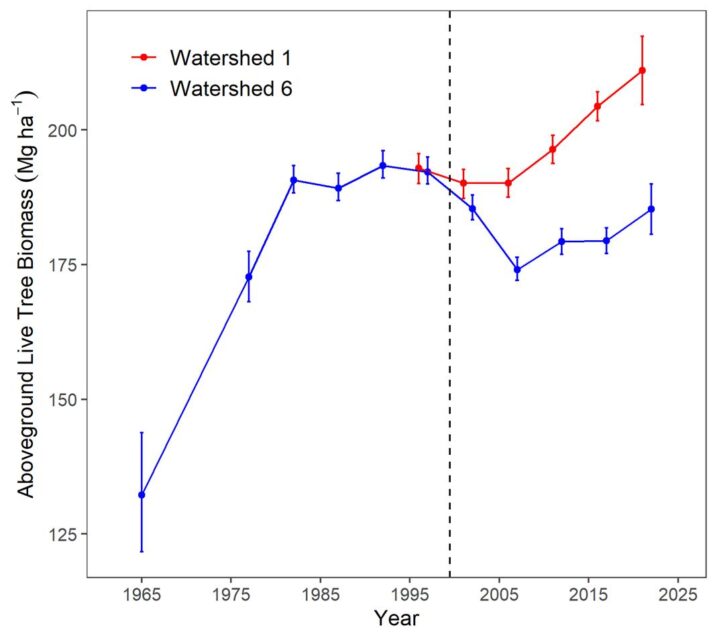
Figure 2-2. Aboveground live tree biomass of the forest on reference watershed 6 and adjacent Ca-treated watershed 1. Error bars indicate 95% confidence intervals based on DBH measurements of all trees on the watersheds.
Primary Productivity
Primary productivity (PP) is defined as the rate of energy or mass storage in organic matter of plants per unit surface area of the earth. In terrestrial ecosystems PP is conventionally divided into two components: 1) gross primary productivity (GPP) is the amount of organic material synthesized by plants per unit ground area per unit time, and 2) net primary productivity (NPP) is the amount of this organic material that remains after respiratory consumption of organic matter by the plants (Ra). All heterotrophic organisms rely on NPP for their food requirements. In forests, Clark et al. (2001) emphasized that a working definition of NPP for actual measurements must be adapted from the formal definition (above) because direct measurements of GPP and Ra are not possible and accounting for a variety of other losses of organic material from plant tissues during a measurement interval also can be challenging. In theory NPP could be quantified as:
Eq. 1. NPP = ∆B + M + H + L + V,
where ∆B is net change in biomass and M, H, L, and V are losses of organic matter from plant tissues owing to mortality, herbivory, leaching and volatilization, respectively. The reason that we must add loss terms like mortality to ∆B when calculating forest NPP is illustrated by the case where ∆B=0: if live biomass doesn’t change over a time interval during which losses of organic material are occurring, then the plants must have added new organic material to replace those losses. Thus, the loss terms would be equal to this new production. To estimate forest NPP at Hubbard Brook we quantify changes in live tree biomass using the allometric equations (described above) and we estimate the principal loss terms, tree mortality and mortality of ephemeral tissues (leaves and fine roots). Some of the other loss terms in Equation 1 also have been measured at Hubbard Brook. Although H, L and V usually comprise a relatively small proportion of aboveground NPP (ANPP), herbivory can be substantial during rare irruptions of defoliating insects. For example, during the peak year of a 3-yr irruption of a defoliating caterpillar (Heterocampa guttivita) about 44% of leaf tissue was consumed in the hardwood forest at HBEF, with local patches of 100% defoliation (Holmes and Sturges 1975). Finally, loss terms for belowground NPP (BNPP) are notoriously difficult to measure and can comprise a substantial portion of NPP that is particularly sensitive to environmental changes, climate, atmospheric CO2 and soil fertility.
| Biomass Components | g/m2 (1997) |
|---|---|
| Foliage | 402 |
| Branch | 5436 |
| Bark | 1220 |
| Wood | 11932 |
| Total aboveground biomass | 18990 (248) |
| Root crown | 1580 |
| Lateral woody roots | 2920 |
| Fine roots (< 1mm) | 522 |
| Total belowground biomass | 5022 (638) |
| Total plant biomass | 24012 |
| Production Components | g/m2-yr (1997) |
| Aboveground annual tissues | 342 |
| Aboveground perennial tissues | 366 |
| Total ANPP | 708 (62) |
| Fine roots | 182 |
| Coarse roots | 76 |
| Rhizosphere flux | 160 |
| Total BNPP | 418 |
| Total NPP | 1126 |
The first estimates of ANPP of the Hubbard Brook forest were calculated in the 1960s by Whittaker et al. (1974). At that time the forest on W6 was about 50 yrs old and ANPP was estimated at 924 g/m2-yr. Since that time ANPP has declined considerably; Fahey et al. (2005) estimated ANPP of the same forest at age ca. 90 yrs to be 708 g/m2-yr (Table 1). Roughly half of this total was associated with increment of woody tissue and half with replacement of ephemeral tissue (mostly foliage). The ANPP of the northern hardwood forest at Hubbard Brook is similar to a variety of other mature Acer-dominated forests worldwide (Table 2).
| Location | Ref.d/ | ANPP
(g/m2-yr) |
FPEa/
LAI-basis |
FPEb/
Mass-basis |
Wood PEc/ |
|---|---|---|---|---|---|
| HBEF, NH age = 45 yr | 1 | 924 | 147 | 2.28 | na |
| HBEF, NH age = 85 yr | 2 | 708 | 112 | 1.76 | 0.91 |
| Indiana mesic slope | 3 | 678 | 161 | 2.19 | 1.28 |
| Indiana bottomland | 3 | 639 | 141 | 2.06 | 1.04 |
| Wisconsin | 4 | 755 | 137 | 2.02 | 1.02 |
| Wisconsin sandy outwash | 5 | 480 | 161 | na | na |
| Wisconsin ground moraine | 5 | 920 | 133 | na | na |
| Himalayas, India | 6 | 990 | 193 | 1.80 | 0.80 |
| Upstate New York | 7 | 772 | 119 | 2.38 | 1.23 |
Belowground production (BNPP) includes the growth of perennial woody roots, the replacement of ephemeral fine roots as well as organic matter allocated to mycorrhizal fungi and other rhizosphere fluxes (e.g. root exudation). Direct observations of fine roots at Hubbard Brook using minirhizotrons indicate that most of the smallest first-and second-order roots have lifespans of about one year while higher order (order 3-4) roots live for several years (Tierney and Fahey 2001). On the basis of these observations fine root (< 1mm) production has been estimated at 182 g/m2-yr, considerably lower than the production of aboveground ephemeral tissues (342 g/m2 yr; Table 2). However, total rhizosphere C flux has been estimated to be as high as 160 g/m2-yr (Fahey et al. 2005) so that BNPP may comprise as much as 37% of total forest NPP (Table 1).
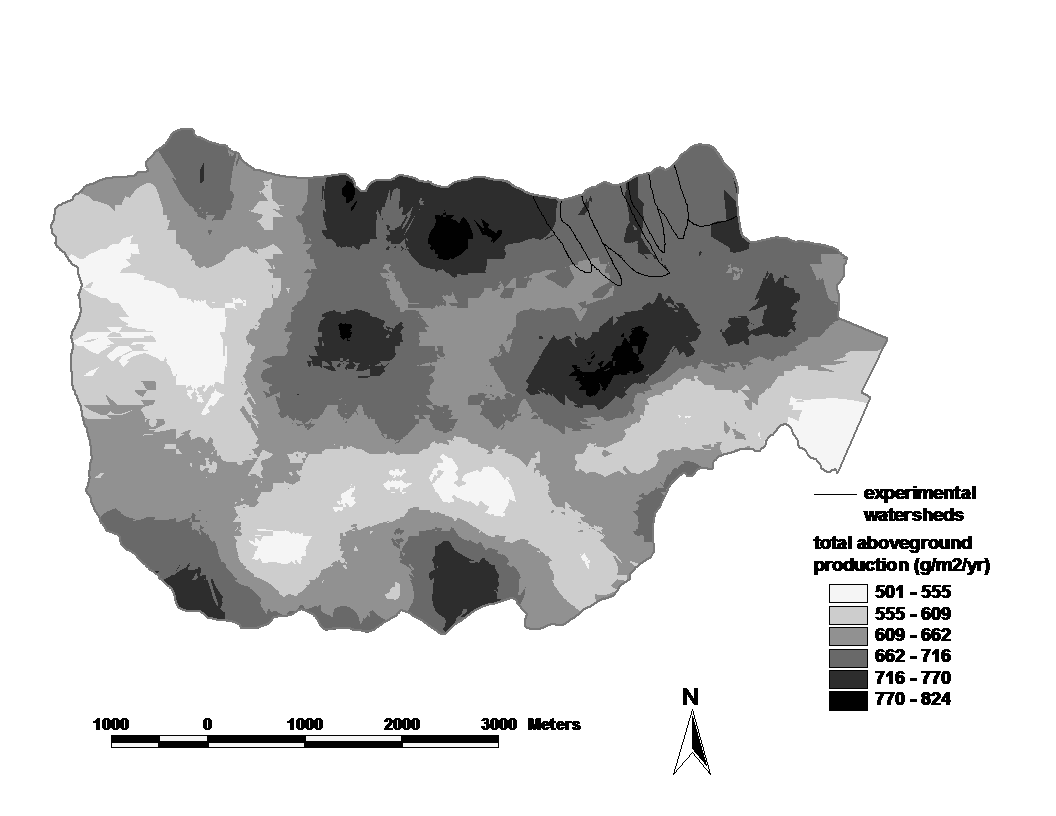
Figure 3. Spatial pattern of estimated aboveground net primary productivity across the Hubbard Brook valley for 1990-1995.The interpolations are based on 370 plots for which diameter growth of all trees (> 10 cm DBH) was measured. Error estimates are given in the text. (Fahey et al., 2005)
The spatial pattern of ANPP of the Hubbard Brook forest generally reflects that of biomass (compare Figure 2 vs. 3).
For example, 42% of the variation in woody biomass production is explained by aboveground biomass across the 370 plots represented in Figure 2 and 3. The most notable decoupling between biomass and productivity is for fir-birch-spruce dominated stands at the upper elevations, where the production:biomass ratio is notably higher than elsewhere in the HB valley. The temporal pattern of NPP following large-scale disturbance follows the usual pattern of increase to a peak value after a few decades, followed by decline at greater ages. Such an age-related decline in NPP appears to be virtually universal in all forests (Ryan et al. 1997) and has been attributed to a wide range of causes. These temporal and spatial patterns beg the basic question: what limits NPP in the Hubbard Brook forest?
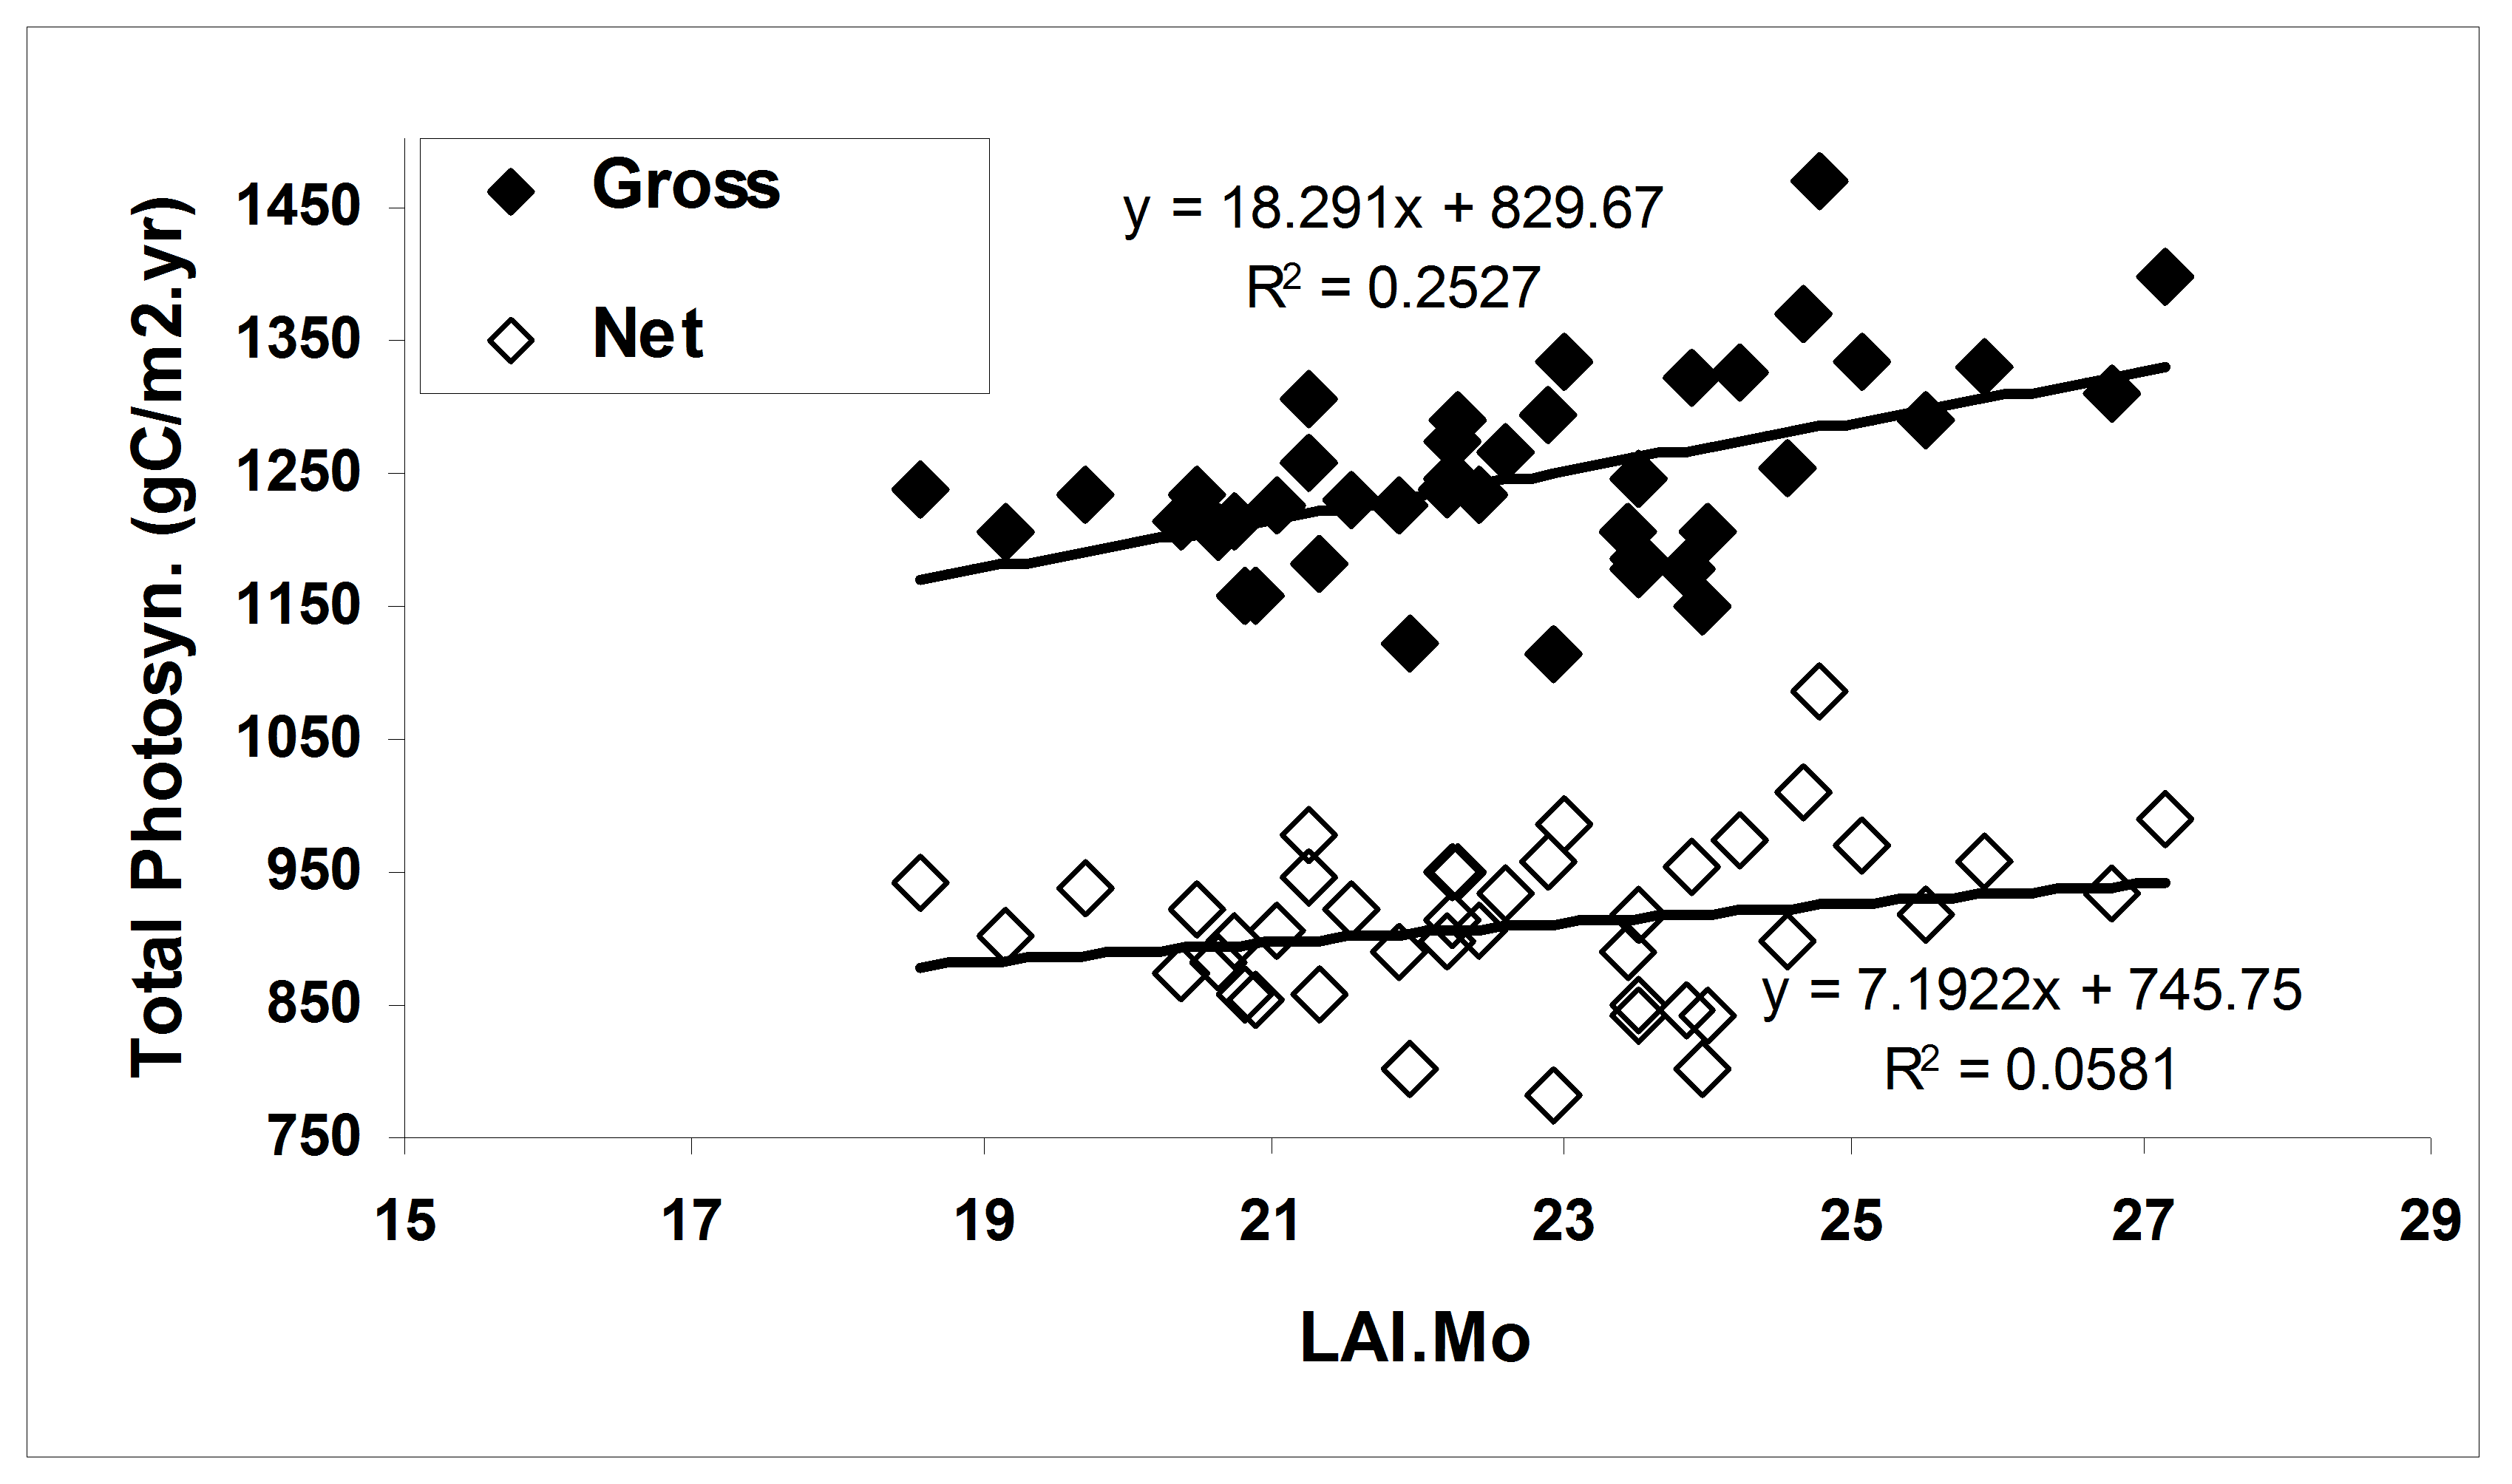
Figure 4. The effect of growing season length on simulated primary productivity using the model PnET-II (Aber et al. 1995) parameterized for a northern hardwood forest at the HBEF. Leaf area duration (LAIMo) represents the product of daily estimated forest LAI and monthly time intervals for each year. (Fahey et al., 2005).
In general, forest NPP is limited by a variety of environmental conditions (e.g., temperature) and resources. In the cold temperate climate of the Northeast the short growing season during which temperatures are suitable for plant growth (i.e., the frost-free season averages 145 d; Bailey et al. 2003) is a fundamental constraint on NPP. Temperature limitations contribute to both temporal and spatial variation in NPP at Hubbard Brook. For example, the time interval between leaf out and senescence for the broadleaf deciduous trees varies by about 30 d across years at HBEF (ca. 125-155 d; Bailey et al. 2003), and the range of this index of growing season length across elevation (480-820 m) at Hubbard Brook is about 21 days. According to the simulation model PnET about 25% of annual variation in GPP can be explained by growing season length; however, plant respiration also is greater in years with long, warm seasons, so that the effect on NPP is much lower (e.g., only 6% of annual in net photosynthesis is explained by growing season length; Figure 4).
Another atmospheric condition that limits forest NPP is atmospheric CO2 concentration as demonstrated in free-air CO2 enrichment (FACE) studies in several forests (Norby et al. 2005). Although FACE experiments have not been conducted at HBEF, we have used the PnET model to evaluate possible effects of rising CO2 on NPP, independent of climate change effects. One key effect of rising atmospheric CO2 concentration on forest physiology is to allow greater stomatal control over water loss. Water-use efficiency (WUE) is defined as the ratio of plant photosynthesis per unit water loss by transpiration. Recent measurements indicate that the WUE of northeastern U.S. forests has risen steadily with atmospheric CO2 over the past two decades (Keenan et al. 2013), probably explaining the unexpected observation that declining actual evapotranspiration from the HB watersheds has accompanied rising temperatures (see Climate Change chapter)
The water-use efficiency result emphasizes that soil resource availability serves as an important constraint on forest NPP. Although precipitation is moderately high at HBEF and evenly distributed through the year, soil moisture deficits and drought stress occur occasionally. The dominant tree species are drought avoiders that close their stomata at relatively high soil water potential, thereby reducing potential damage but restricting photosynthetic C gain (Federer 1977). Notably, regional climate warming, which in the absence of CO2-induced increases in WUE would promote higher water loss by the trees, has been accompanied by increasing annual precipitation (see Climate Change chapter)
The role of soil fertility in limiting NPP of northern hardwood forests has received considerable study over the years. Based on a recent meta-analysis of forest fertilization studies, Vadeboncoeur (2010) concluded that NPP of most young northern hardwood forests (e.g. < 30 yr) responded to the addition of N, P, K or Ca or various combinations, with primary limitation by N being most common. Evidence for nutrient limitation of NPP in mature forests was mixed. Recent results from an ongoing N x P nutrient amendment experiment in and around HBEF suggest that P limitation may be widespread in mature northern hardwood forests.
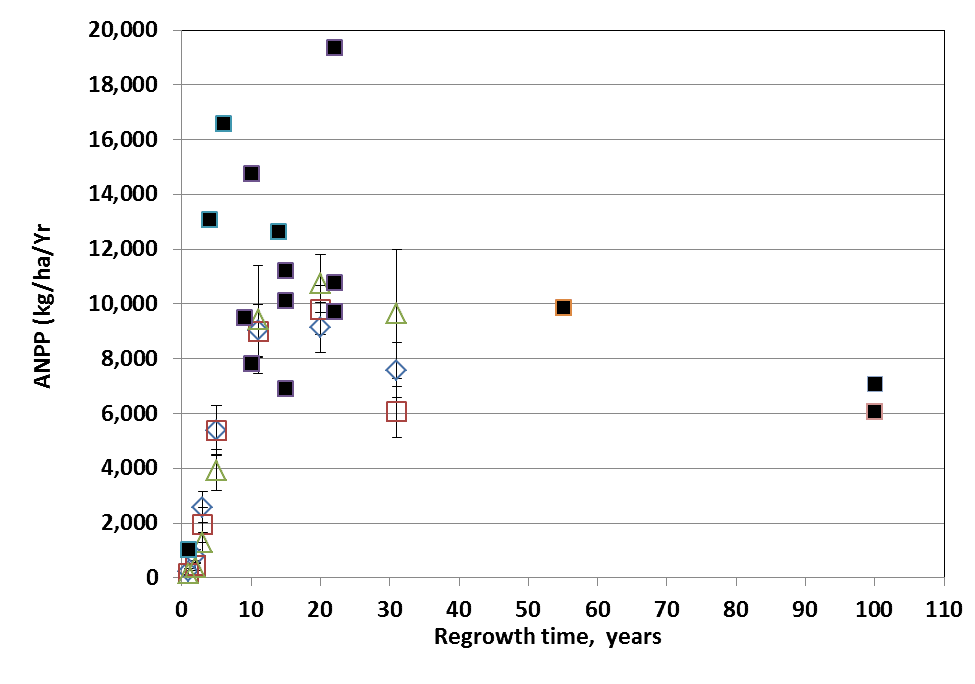
Figure. 5. ANPP for three elevational zones of W2 (open diamond, lower third; open square, middle third; open triangle, upper third) compared with site averages for conventionally harvested sites (solid squares). (Reiners et al., 2012).
The effects of natural variation in soil nutrient availability on biomass accumulation and NPP of the Hubbard Brook forest have been modified by inputs of pollutants derived from human activity: acid precipitation and nitrogen deposition. Although direct evidence that N deposition has altered NPP of the mature forest is scant, reduction of NPP owing to depletion of soil base cations by acid deposition has been shown conclusively in the Ca remediation experiment on W1 at HBEF(Battles et al. 2013). As noted earlier, the unexpected plateau in forest biomass on W6 is explained in part by this effect. Specifically, soil Ca depletion has limited biomass accumulation primarily by causing decline of the dominant species, sugar maple, which is particularly sensitive to low soil Ca availability (Long et al. 2009). Crown deterioration and reduced LAI of sugar maple, attributed to soil Ca depletion, has contributed to the relatively low ANPP and biomass accumulation on W6 (Battles et al. 2014). In addition to reduced net photosynthesis owing to LAI loss, higher costs of wound repair and plant defense accompany the impaired Ca nutrition of sugar maple in the reference forest (Huggett et al. 2007; Halman et al. 2015). As detailed by Tominaga et al. (2010), recovery of soil base cation status is expected to be delayed in the immediate future because of the high magnitude of 20th century losses and continuing acid deposition (albeit at lower levels).
An interesting case study of the development of forest biomass and NPP following large-scale disturbance in northern hardwoods is provided by the deforestation study on W2. Reiners et al. (2012) hypothesized that the extreme disturbance of the deforestation treatment on W2 (see W2 Experimental Summary) would exceed the capacity for forest ecosystem resilience. In particular, the treatment resulted in loss of 28% of the ecosystem stock of total N (as well as smaller proportions of base cations); eliminated vegetative sprouting and advance regeneration as sources of forest regeneration; and greatly reduced the abundance of fast-growing pin cherry. Surprisingly, despite an initial lag in biomass accumulation and net primary productivity, the forest on W2 followed a trajectory similar to (though on the low end) of comparable sites that had been harvested by conventional methods (Figure 5).
The slowest growth and biomass accumulation were observed in the upper elevation zone of the watershed where soils are thinner and less fertile (Johnson et al. 2000). These observations illustrate that northern hardwoods forests on moderately fertile soils exhibit strong resilience of productivity. The mechanisms contributing to this high resilience deserve further study but may include biologically-enhanced weathering of primary minerals (Blum et al. 2002), biological nitrogen fixation (Bormann et al. 1993) and enhanced mineralization of relatively stable soil organic matter.
Forest Leaf Area Index
Forest productivity is powered by the capture of solar radiant energy by plant foliage. The standard measurement of foliage abundance that carries out this function is leaf area index (LAI), defined as the
(one-sided) area of foliage in the entire plant canopy per unit ground area; essentially LAI is the number of layers of canopy foliage. In mesic forests like Hubbard Brook with a closed canopy, where LAI is little constrained by soil water availability, the maximum LAI is limited by self-shading because foliage at the bottom of the canopy receives insufficient insolation to effectively carry out the photosynthetic function. Forest LAI can be measured in a variety of ways, including LIDAR that can remotely sense objects in the canopy; however, this relatively recent tool measures plant area index, including stem/branch surfaces and requires correction factors. In the deciduous northern hardwood forest that dominates the Hubbard Brook landscape, LAI can also be measured conveniently by quantifying leaf litterfall. Litterfall records for the Hubbard Brook Forest go back over thirty years (Figure 6) and also allow estimation of LAI of each of the various tree species.
The total LAI of the northern hardwood forest adjacent to reference W6 averages a little less than 6. In the absence of disturbances LAI is pretty constant from year to year, but considerable spatial variation across the study area is observed (Figure #): the highest values of 7 to 8 are observed in coves with enriched soils and sugar maple dominance while the lowest values (3.5 to 4) coincide with thin depleted soils in the upper watershed. Comparison between the reference forest adjacent to W6 and the Ca-treated W1 (Figure #) illustrates the role of soil base status and sugar maple health in regulating forest LAI and NPP in the experimental watersheds at Hubbard Brook. These patterns reflect site quality variation that clearly constrains the NPP of the wider forest landscape.
The temporal pattern in LAI also reflects the effect of disturbances. In particular, a clear decrease in forest LAI accompanied disturbance by the 1998 ice storm: LAI was reduced in half for two years before gradually recovering to pre-disturbance levels by about 2003-4 (Figure 6). Since that time LAI has been relatively constant on a large-scale average, although localized decreases have been observed resulting from smaller disturbances (late-spring frost, microburst windstorm). Continued monitoring is needed to allow researchers to capture effects of environmental change on forest health and dynamics (Fahey et al. 2022).
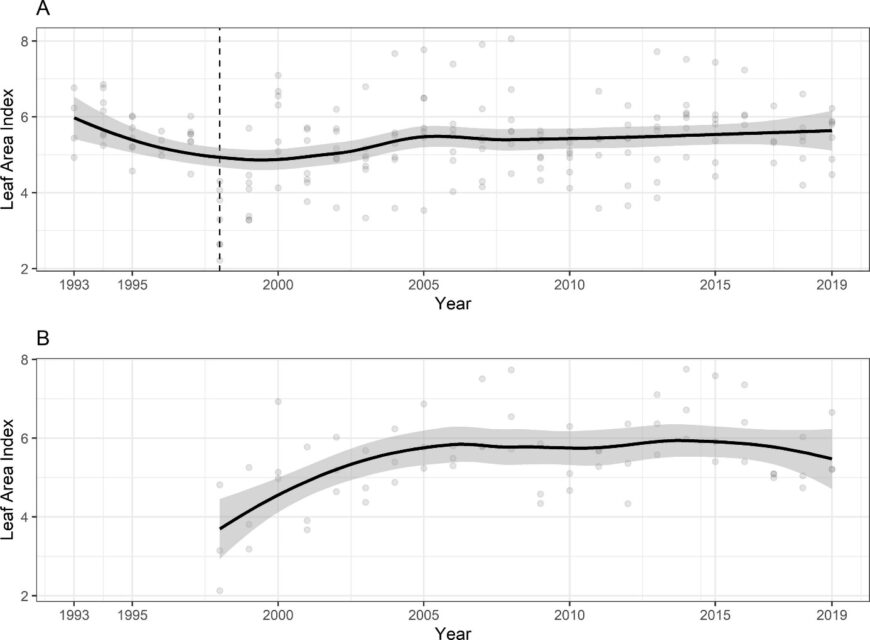
Figure 6. Leaf area index of northern hardwood forest measured based on leaf litterfall A. adjacent to reference watershed 6 and B. calcium-treated watershed 1. Data points indicate annual estimates for six monitored forest stands adjacent to W6 and three stands in W1.
Questions for Further Study.
- What are the mechanisms contributing to soil nutrient limitation of forest productivity?
- Why does forest NPP decline with stand age – so-called “age-related NPP decline”?
- How does BNPP associated with rhizosphere carbon flux vary across the forest landscape, and what environmental and biotic factors influence this flux pathway?
- How will forest NPP respond to the long-term amelioration of soil calcium depletion on WS1?
- Conversely, will the depletion of soil calcium resulting from whole-tree harvest limit forest NPP on WS5?
- How will forest NPP and biomass accumulation respond to continued changes in climate and atmospheric carbon dioxide concerntration?
References
Bailey, A. S., J. W. Hornbeck, J. L. Campbell and C. Eagar. 2003. Hydro-meteorological database for Hubbard Brook Experimental Forest: 1955-2000. USDA Forest Service, Northeastern Research Station, Gen. Tech. Report NE-305:36 pp.
Battles, J. J., T. J. Fahey, C. T. Driscoll Jr, J. D. Blum and C. E. Johnson. 2014. Restoring soil calcium reverses forest decline. Environmental Science and Technology Letters 1(1):15-19.
Blum, J. D., A. Klaue, C. A. Nezat, C. T. Driscoll, C. E. Johnson, T. G. Siccama, C. Eagar, T. J. Fahey and G. E. Likens. 2002. Mycorrhizal weathering of apatite as an important calcium source in base-poor forest ecosystems. Nature 417:729-731.
Bormann, B. T., F. H. Bormann, W. B. Bowden, R. S. Pierce, S. P. Hamburg, D. Wang, M. C. Snyder, C. Y. Li and R. C. Ingersoll. 1993. Rapid N2 fixation in pines, alder and locust: evidence from the sandbox ecosystem study. Ecology 74(2):583-598.
Bormann, F. H. and G. E. Likens. 1979. Pattern and Process in a Forested Ecosystem. Springer-Verlag New York Inc. 253 pp.
Clark, D. A., S. Brown, D. Kicklighter, J. Q. Chambers, J. R. Thomlinson, and J. Ni. 2001. Measuring net primary production in forests: concepts and field methods. Ecological Applications 11:356-370.
Fahey, T. J., Cleavitt, N. L., & Battles, J. J. (2022). Long term variation of leaf abundance in a northern hardwood forest. Ecological Indicators, 137, 108746.
Fahey, T.J., R.E. Sherman and D.A. Weinstein. 2013. Demography, biomass and productivity of a northern hardwood forest on the Allegheny Plateau. The Journal of Torrey Botanical Society 140(1):52-64.
Fahey, T. J., T. G. Siccama, C. T. Driscoll, G. E. Likens, J. Campbell, C. E. Johnson, J. D. Aber, J. J. Cole, M. C. Fisk, P. M. Groffman, R. T. Holmes, P. A. Schwarz and R. D. Yanai. 2005. The biogeochemistry of carbon at Hubbard Brook. Biogeochemistry 75(1):109-176.
Fahey, T. J., J. W. Hughes, M. Pu and M. A. Arthur. 1988. Root decomposition and nutrient flux following whole-tree harvest of northern hardwood forest. Forest Science 34(3):744-768.
Federer, C. A. 1977. Leaf resistance and xylem potential differ among broadleaved species. Forest Science 23(4):411-419.
Halman, J. M., P. G. Schaberg, G. J. Hawley, L. A. Pardo and T. J. Fahey. Calcium and aluminum impacts on sugar maple physiology in a northern hardwood forest. Tree Physiology, in review.
Holmes, R. T. and F. W. Sturges. 1975. Bird community dynamics and energetics in a northern hardwoods ecosystem. Journal of Animal Ecology 44:175-200.
Huggett, B. A., P. G. Schaberg, G. J. Hawley and C. Eagar. 2007. Long-term calcium addition increases growth release, wound closure, and health of sugar maple (Acer saccharum) trees at the Hubbard Brook Experimental Forest. Canadian Journal of Forest Research 37: 1692-1700.
Jenkins, J. C., D. C. Chojnacky, L. S. Heath and R. A. Birdsey. 2003. National-scale biomass estimators for United States tree species. Forest Science 49:12-35.
Johnson, C. E., C. T. Driscoll, T. G. Siccama and G. E. Likens. 2000. Element fluxes and landscape position in a northern hardwood forest watershed-ecosystem. Ecosystems 3:159-184.
Keenan, T. F., D. Y. Hollinger, G. Bohrer, D. Dragoni, J. W. Munger, H. P. Schmid, and A. D. Richardson. 2013. Increase in forest water use efficiency as atmospheric carbon dioxide concentrations rise. Nature, in press.
Keeton, W. S., A. A. Whitman, G. G. McGee and C. L. Goodale. 2011. Late-successional biomass development in northern hardwood-conifer forests of the northeastern United States. Forest Science 57:489-505.
Kelty, M.J. 1989. Productivity of New England hemlock/ hardwood stands as affected by species composition and canopy structure. Forest Ecology and Management 28:237-257.
Lichstein, J. W., C. Wirth, H. S. Horn and S. W. Pacala. 2009. Biomass chronosequences of United States forests: Implications for carbon storage and forest management, pp. 301-341. In C. Wirth et al. (eds.), Old Growth Forests. Ecological Studies 207, Springer-Verlag, Berlin.
Long, R. P., S. B. Horsley, R. A. Hallett and S. W. Bailey. 2009. Sugar maple growth in relation to nutrition and stress in the northeastern United States. Ecological Applications 19:1454–1466. doi:10.1890/08-1535.1
Norby, R. J., E. H. DeLucia, B. Gielen, C. Calfapietra, C. P. Giardina, J. S. King, J. Ledford, H. R. McCarthy, D. J. P. Moore, R. Ceulemans, P. De Angelis, A. C. Finzi, D. F. Karnosky, M. E. Kubiske, M. Lukac, K. S. Pregitzer, G. E. Scarascia-Mugnozza, W. H. Schlesinger and R. Oren. 2005. Forest response to elevated CO2 is conserved across a broad range of productivity. Proceedings of the National Academy of Sciences 102:18052-18056.
Reiners, W. A., K. L. Driese, T. J. Fahey and K. G. Gerow. 2012. Effects of three years of regrowth inhibition on the resilience of a clear-cut northern hardwood forest. Ecosystems 15:1351-1362, doi:10.1007/s10021-012-9589-0
Ryan, M. G., D. Binkley, J. H. Fownes. 1997. Age-related decline in forest productivity: Pattern and process. Advances in Ecological Research 27: 213–262.
Tierney, G. L. and T. J. Fahey. 2001. Evaluating minirhizotron estimates of fine root longevity and production in the forest floor of a temperate broadleaf forest. Plant and Soil 229(2):167-176.
Tominaga, K., J. Aherne, S. A. Watmough, M. Alveteg, B. J. Cosby, C. T. Driscoll, M. Posch and A. Pourmokhtarian. 2010. Predicting acidification recovery at the Hubbard Brook Experimental Forest, New Hampshire: Evaluation of four models. Environmental Science & Technology 44 (23) (December): 9003-9009. doi:10.1021/es102243j
Vadeboncoeur M. A. 2010. Meta-analysis of fertilization experiments indicates multiple limiting nutrients in northeastern deciduous forests. Canadian Journal of Forest Research 40:1766-1780. doi:10.1139/X10-127
Whittaker, R. H., F. H. Bormann, G. E. Likens and T. G. Siccama. 1974. The Hubbard Brook Ecosystem Study: forest biomass and production. Ecological Monographs 44(2):233-254.
Woodbury, P. B., J. E. Smith and L. S. Heath. 2007. Carbon sequestration in the U.S. forest sector from 1990 to 2010. Forest Ecology and Management 241:14–27.
Yanai, R. D., J. J. Battles, A. D. Richardson, C. A. Blodgett, D. M. Wood and E. B. Rastetter. 2010. Estimating uncertainty in ecosystem budget calculations. Ecosystems, 13(2), 239-248.


